It pays to look closely at a problem. This worked for Harvard economist Amartya Sen. Sen received his Nobel Prize in large part for developing and refining a seemingly contradictory concept: scarcity can pop up—even flourish—under conditions of abundance.
For Sen the subject was food and famine. In this blog, we’ll discuss water shortages occurring under conditions of abundant precipitation in Oregon’s Willamette River Basin. The basin has the largest specific discharge—that’s total runoff divided by area—of any basin of its size in North America. And yet basin residents could still experience water sacristies in the future. How can that be? We’ll use Sen’s ideas to help answer that question.
The subject of this blog is a paper published last fall in the Proceedings of the National Academy of Sciences with the telling title, “Finding water scarcity amid abundance using human–natural system models.”
The paper covers the Willamette Water 2100 (WW2100) project, an effort to scientifically model the dynamic interaction of human, ecological, and climate factors in the Willamette River Basin and how they are likely to affect the basin’s water supply and demand to the year 2100.
The paper was led by Oregon State University’s William Jaeger and includes contributions from multiple project participants, including CIRC Researcher Adell Amos and OCCRI Director and CIRC Co-lead Philip Mote.
WW2100 was primarily funded by the National Science Foundation, and included researchers from across Oregon and a few in California. The expertise of project participants varied from climate and hydrology to economics and law. The project also included stakeholder engagement with local natural resource managers throughout.
CIRC and OCCRI team members provided the climate analysis for the project.
Using a multidisciplinary approach allowed the WW2100 project to parse out key details about how water supply and demand in the basin are likely to change in the future.
Looking closely at water supply and demand led the WW2100 project to a very Sen-like conclusion: water scarcities can exist even amid abundant precipitation.
The gist of Sen’s analysis goes something like this: famines often occur not because there isn’t an adequate supply of food, but because those that most need that food often don’t have the means to acquire it. This might be because they lack adequate infrastructure, such as reliable roads, or because they simply aren’t making enough money to afford food.
Sen is best known for his work focusing on famine in developing countries, but his ideas can be applied to environmental issues in developed countries as well.
As Jaeger and colleagues note in their paper, Sen’s focus on poverty and inadequate infrastructure are “analogous to the cost, profitability, water rights, and other institutions” affecting the Willamette River Basin.
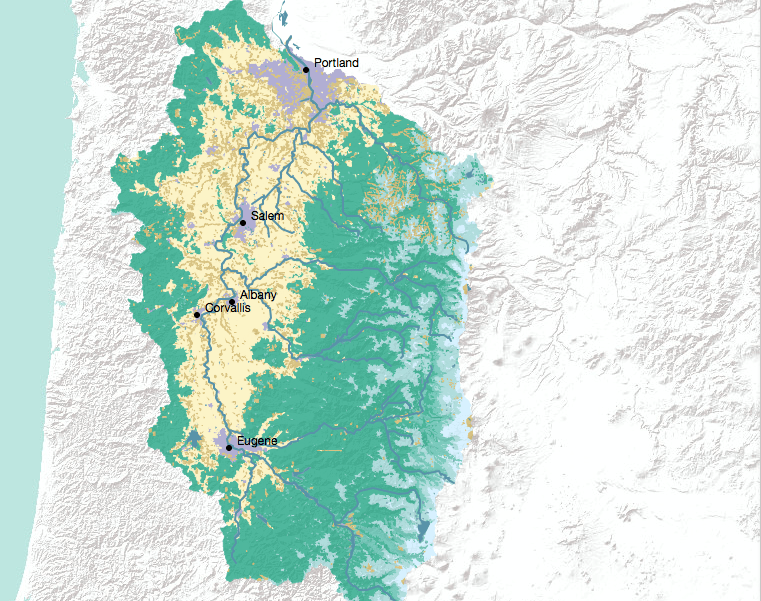
The Willamette River Basin—if you don’t already know—includes the north-flowing Willamette River and its many tributaries; the cities of Eugene, Corvallis, Albany, Salem, and Portland; the very productive Willamette Valley, its farms, wineries, and other American pastoral happenings one can glimpse while speeding along US Interstate 5; and the forests that line the basin’s upland elevations. The basin also includes 13 federal dams.
On top of this physical landscape is a kind of meta-landscape of the basin, the contours and boundaries of which are defined by water rights and the economic costs and benefits of growing food and transporting water. All this was modeled by the WW2100 project.
The WW2100 project, as we’ve noted above, considered and quantified a number of different and interconnected factors driving change in the Willamette River Basin, such as human population growth and rising temperatures.
To see how the different factors might interact with the basin’s physical, legal, and economic landscapes, the WW2100 project employed the ENVISION Integrated Modeling Platform, a dynamic computer model that allows users to run science-based thought experiments using a spatially-explicit model, in this case of the Willamette River Basin.
The result of all this work is a spaghetti-like smorgasbord of data about the basin’s future, an interweaving inter-connecting conglomeration. To visualize this, see the figure below.

Things get Sen-like when one starts to fork through the data spaghetti.
So, let’s not take a mouthful and instead consider just a morsel: the demands agriculture places on water supply and how that water supply is likely to be impacted by climate change.
The Willamette River Basin has some 1.5 million acres of farmland, roughly 30% of which has water rights but not all of which is currently irrigated. Unfortunately, as Jaeger and colleagues point out, the basin has a flow problem.
The basin receives most of its water in the winter when farmers —and to lesser extent city dwellers—need it least. However, the basin uses most of its water in summer when there’s less water available.
That’s our water demand. Now let’s consider our water supply and how it is likely to change. (It’s worth mentioning that water demand is likely to change as well. We’ll get to that.)

By the end of this century, according WW2100’s findings, the Willamette River Basin is projected to be between 1 and 7 degrees Celsius (2–13 ° Fahrenheit) warmer than temperatures were during the second half of the 20thcentury (the historical baseline used).
This warming is expected to lower the flow of the Willamette River by increasing evaporative demand from plants and soil and lowering mountain snowpack (by 74–94%). The result is an expected decrease in summer flows. (Summer is defined in the project as July through September.) For instance, the lower half of the basin is expected to see a decline in summer flows of 15% for every 1° C (2 ° F) increase in annual mean temperature experienced.
At the same time, annual precipitation in the basin is not expected to change significantly in response to climate change. Like the Pacific Northwest more generally, the river basin’s summers might become a little drier and its winters might become a little wetter. What we have, note the study’s authors, is a situation where water scarcities could occur in a place of relative water abundance.
So, you might be wondering, if the flows are changing why not just store the water? Well…it’s not that easy.
Time to look through our Sen lens.
Yes, the Willamette River Basin has 13 federal dams, but as Jaeger and colleagues point out, the problem isn’t storage. It’s delivery.
Here we should remember Sen’s roads and the physical and meta-landscapes of the Willamette River Basin.
According to the study’s analysis most of the farmland in the study is not adjacent to water courses downstream of dams. This adds a cost to getting that water to farms.
Assuming that farmers would pay to transport the water if it were profitable to do so, the WW2100 team set about determining the sort of cost-benefit analysis that a farmer might calculate to determine if paying for an upgrade to transport water would be profitable. In most cases, note the authors, it would not be profitable.
Jaeger and colleagues note that “only 1–3% of unirrigated land would be able to bring stored surface water into use profitably, due to the high transport costs.”
Okay, so now you’re probably thinking, that seems like a no brainer, why are you telling me all this? But here’s where things get really counter intuitive. We’ve talked about scarcity amid abundance what about abundance amid scarcity?
Remember when we mentioned that rising temperatures are likely to cause earlier stream flows? Well, warmer temperatures also mean an earlier start to the growing season. This, as Jaeger and colleagues point out, means that a higher amount of irrigation could occur earlier, raising the possibility that some of the basin’s farmers could learn to adapt to the climate change, finding abundance amid scarcity by planting earlier in conjunction with the changing flows and temperatures.
The paper—and the WW2100 project in general—has other Sen-like examples that result from parsing the pasta of complexity—what the authors call paying attention to “high spatial and temporal specificity”—but you get the idea.
If there is a takeaway from this paper and the WW2100 project it’s this: in adaptation work, it pays to see things through a Sen lens, a lesson many climate adaptation projects should take to heart.
![]() Publication:
Publication:
Jaeger, William K., Adell Amos, Daniel P. Bigelow, Heejun Chang, David R. Conklin, Roy Haggerty, Christian Langpap, Kathleen Moore, Philip W. Mote, Anne W. Nolin, Andrew J. Plantinga, Cynthia L. Schwartz, Desiree Tullos and David P. Turner. “Finding water scarcity amid abundance using human–natural system models.” Proceedings of the National Academy of Sciences 114, no. 45 (2017): 11884-11889. https://doi.org/10.1073/pnas.1706847114.
![]() Resources:
Resources:
- Willamette Water 2100 project website
- CIRC and OCCRI’s Climate Analysis for Willamette Water 2100
- WW2100 Key Findings
![]()
Related Stories:
- “Changes Ahead for Oregon’s Willamette River Basin”
- “A New Approach to Tracking Hydrologic Responses to Climate Change”
- “Carbon Balance and Forest Disturbance in the West Cascades”
- “Modeling Ecological Changes to US Forests”
- “Putting the Sensitivity Approach into Practice for WW2100”
![]() Findings:
Findings:
- Water scarcities can exist even amidst abundant precipitation.
- By 2100, the Willamette River Basin is projected to be between 1 and 7 degrees Celsius (2–13 ° Fahrenheit) warmer than temperatures were during the second half of the 20thcentury (the historical baseline used).
- Water scarcities could result from changes to summer flows.
- Farmers could compensate for changes in flows by planting earlier in the year.
- Due to high transportation costs, only 1–3% of currently unirrigated land in the Willamette River Basin would be able to bring stored surface water into use profitably.
![]() Pics and Figures:
Pics and Figures:
Figure One: Map of the Willamette River Basin. Image taken as a screenshot on WW2100 project website using an interactive map feature. http://hydro-prod.library.oregonstate.edu/figures/ww2100_map/.
Featured Image/Figure Two: Map of the Willamette River Basin. Image taken as a screenshot on WW2100 project website using an interactive map feature—which is super cool. Check it out: http://hydro-prod.library.oregonstate.edu/figures/ww2100_map/.
Nathan Gilles is the managing editor of The Climate Circulator, and oversees CIRC’s social media accounts and website. When he’s not writing for CIRC, Nathan works as a freelance science writer. Other Posts by this Author.

